Manual / The card
The dashboard card
A custom BavarianData Card is bundled with the integration and registered automatically as a dashboard resource — there is no resource to add by hand, and it is refreshed on every update so browsers pick up the new version.
The integration does not create a dashboard of its own. Registering the resource makes the card available; you place it where you want it:
-
Open any dashboard and click ✏️ Edit → ➕ Add card.
-
Search for BavarianData Card and pick it — a visual editor opens.
-
Save. The minimal config auto-discovers the car, so there is nothing to fill in:
type: custom:bavariandata-card
Automatic registration needs storage-mode resources, which is the default. If your dashboard resources are YAML-managed you must add the resource yourself — see Troubleshooting.
The card has several views. The default is the Overview; set view: or
cluster: to switch. Use one card per view — add several cards to a
dashboard to show them side by side.
If the card doesn’t show up after an update, hard-refresh the browser. If it renders in a browser but the companion app shows Custom element doesn’t exist, clear the app’s frontend cache — see Troubleshooting.
- Overview
- Charging history
- Battery health
- Efficiency & range
- Trips / driving journal
- Trip map
- Tires
- Security & closures
- Single-cluster list
- Full YAML reference
Overview#
The vehicle render, a ring, the range and a grid of key metrics. What they show follows the car’s drivetrain, which the card works out from what the car streams:
| Drivetrain | Ring | Beside it | Grid |
|---|---|---|---|
| Electric | State of charge (blue while charging) | Remaining range, charging status | Target, plug, time to full, odometer |
| Plug-in hybrid | State of charge | Electric range, charging status | Tank, total range, target, plug, time to full, odometer |
| Petrol / diesel | Tank level — or the volume in the tank, on a car that doesn’t stream a percentage | Remaining range, and the tank volume or the odometer | Odometer |
| Neither, proved | Remaining range | Odometer | — |
The state of charge on the ring is the integration’s own estimate. While the car is parked that is simply BMW’s last reading; while it charges it keeps climbing at the rate the charging power implies, because BMW can go silent for hours mid-charge and its own figure then stands still. The next real reading replaces it. See the charging page.
A car that sends high-voltage battery data and fuel data is a plug-in hybrid; fuel data alone makes it petrol or diesel. Some petrol cars stream an EV charge target anyway, so that never makes a car look electric.
A car that has only just been set up has proved nothing yet, and keeps the
electric layout until it does. But a car that has been talking for a while and
sent neither kind of data has proved something: it is not electric, whatever
else it is. Some do — a petrol MINI can stream no fuel system and no engine at
all — and showing it a charge ring it could never fill was simply wrong, so it
gets the last row above instead: its range in the ring, its odometer beside it,
and nothing about charging. If your car lands there and you know better, set
drivetrain: in the card’s YAML.
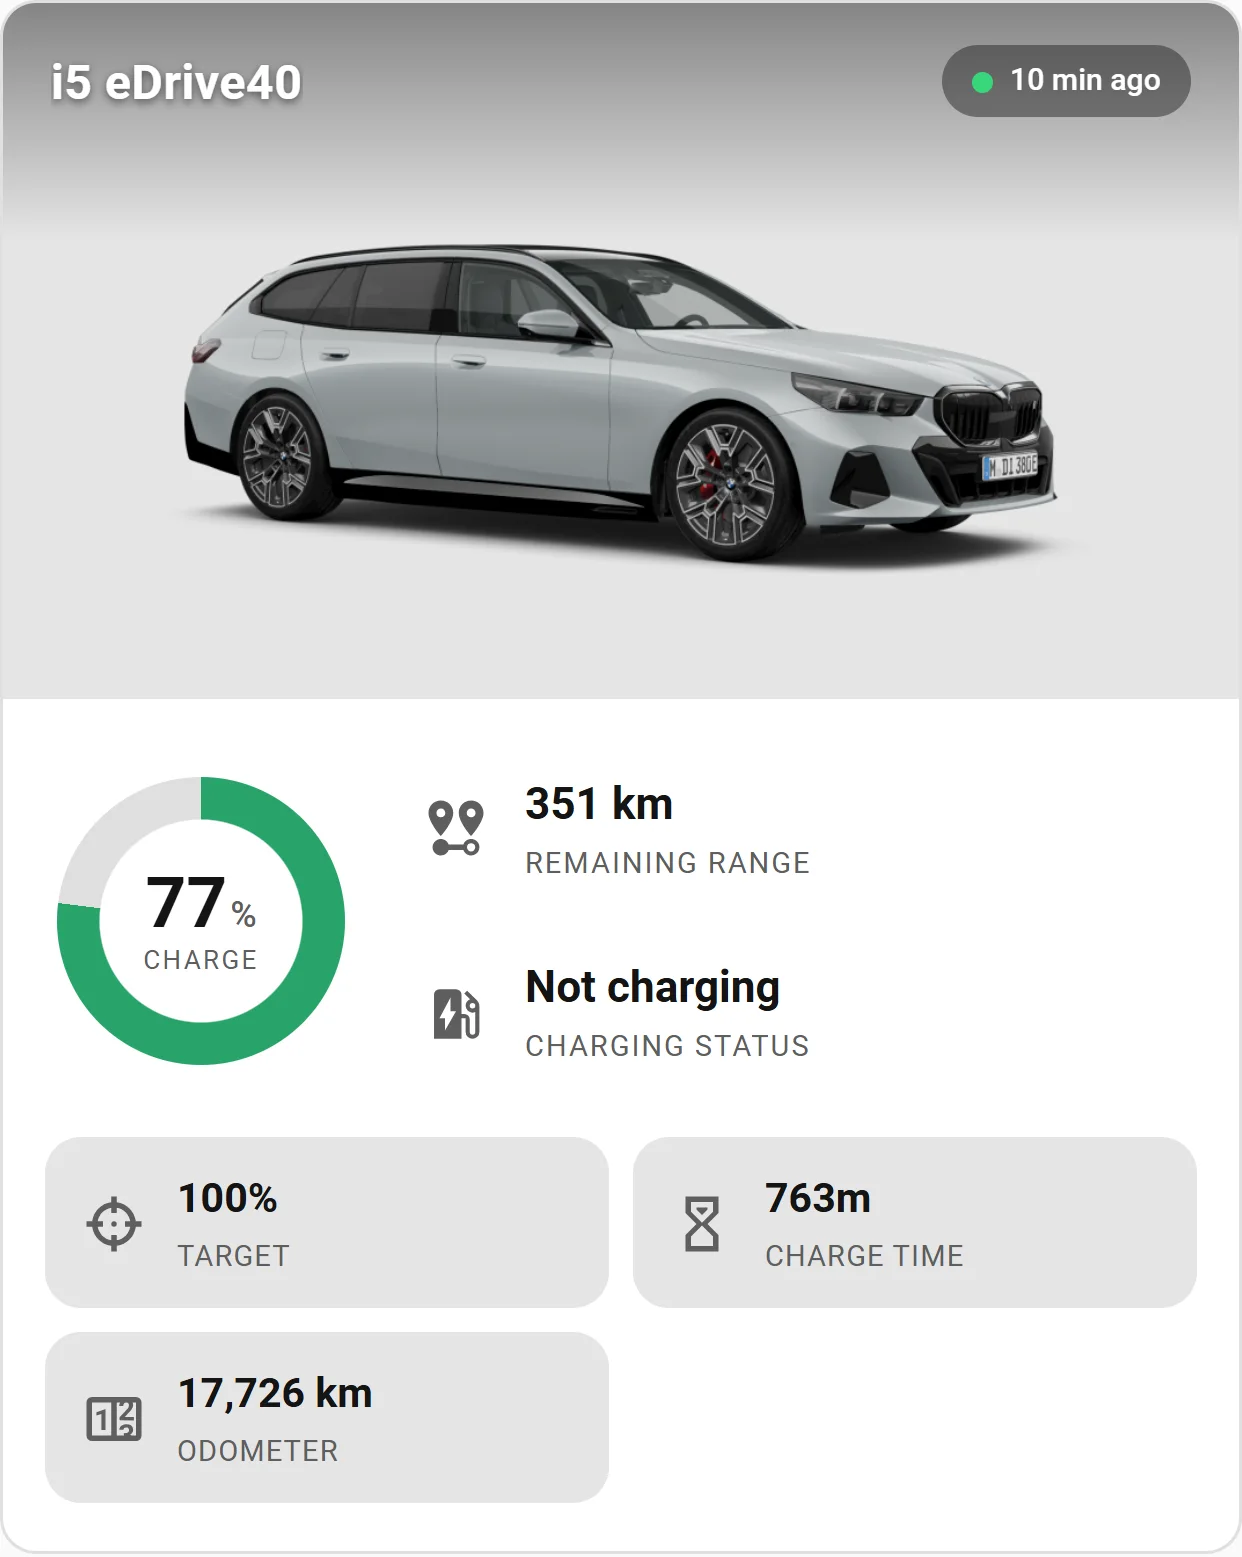
type: custom:bavariandata-cardIf it picks the wrong layout, set Drivetrain in the visual editor, or:
type: custom:bavariandata-card
drivetrain: ice   # bev · phev · ice — omit to auto-detect
The charging, battery-health and efficiency views are built on charging data. On a petrol or diesel car they say so — Nothing to show for this car — rather than sitting empty as if something were broken. If that car does plug in, set Drivetrain.
While a drive is under way, a Trip in progress badge appears at the bottom of the vehicle image with the distance and minutes so far; tap it for the full attributes. It follows the Trip in Progress entity, so it lingers for a few minutes after you arrive — why.
Pin a specific vehicle with device: (device id) or vin:.
Charging history (view: charging)#
Lists recorded charging sessions, newest first, each showing the date, energy, cost and a Home/Away badge. Tap a session to expand its power curve, peak and average power, duration, and grid energy. The “this month” totals ride along the top. CSV and Report buttons export the month you are viewing (see Export).
One month at a time. As on the trips view, a ‹ August 2026 › control under
the header scopes the list to one calendar month; page back for older sessions.
The “this month” totals band appears only on the current month — it is fed by the
monthly sensors, which have no older value to show.
type: custom:bavariandata-card
view: charging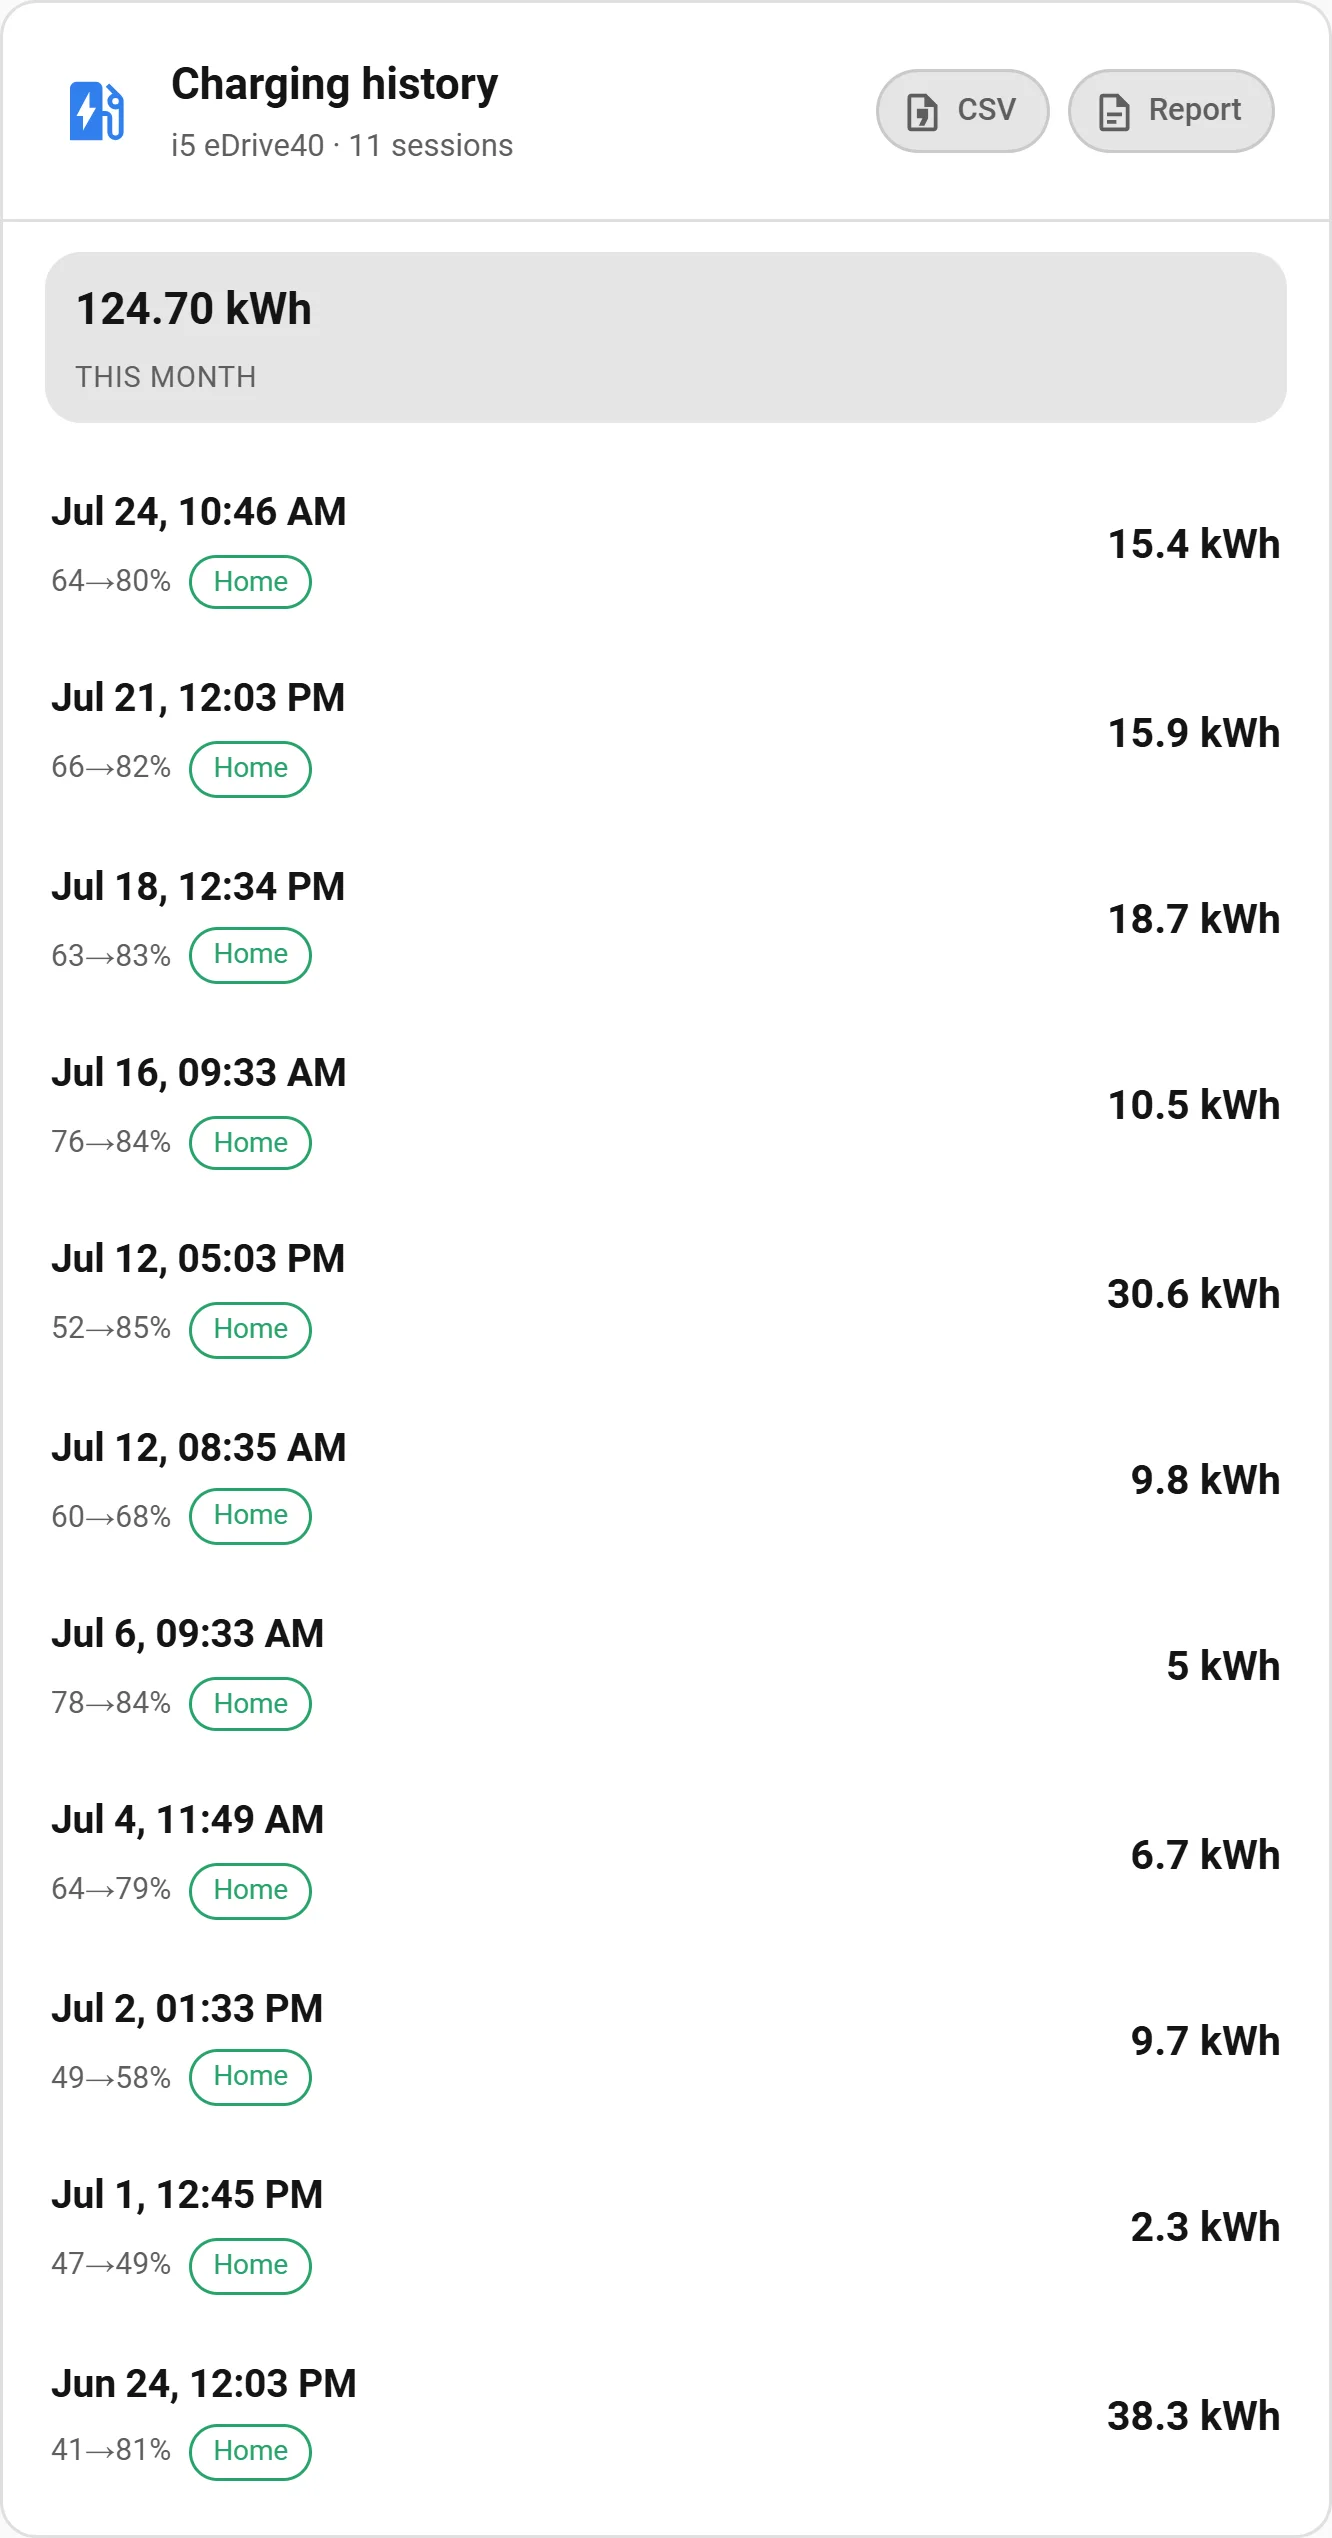
It reads the integration’s stored history via the get_charging_sessions
service, so it spends no API quota. Cost only appears once a price source is
set under Configure → Charging costs & history
(see Charging history & cost); until then
sessions still list with their energy. A session charged without GPS is badged
Home · assumed, and one priced while the tariff was briefly unknown is tagged
partial price.
With Configure → Solar & energy sources set up, a session that could be attributed also carries a ☀ 62 % solar tag, and expanding it adds an Energy source line with the kWh per source (see Where the energy came from). Sessions recorded before those sensors were configured simply have no tag — the card never shows a 0 % that would really mean “not measured”.
Battery health (view: health)#
Shows the learned usable battery capacity as a gauge (percentage of the as-new pack) with a capacity-vs-mileage trend below.
type: custom:bavariandata-card
view: health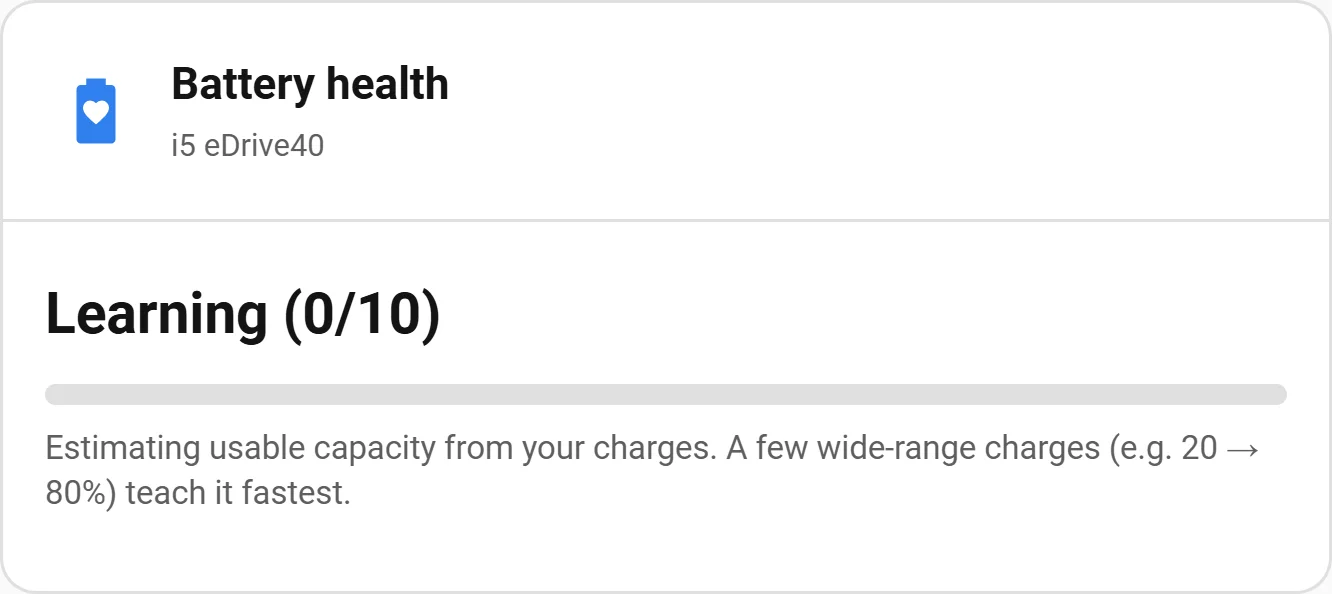
It reads the Battery Health sensor, so it spends no API quota. Until there are enough wide-range charges to be sure of the number, it shows Learning (n/10) rather than a figure that would jump around (how it’s learned).
Efficiency & range (view: efficiency)#
How far the car really goes from its current charge, above the consumption that figure is built on.
type: custom:bavariandata-card
view: efficiency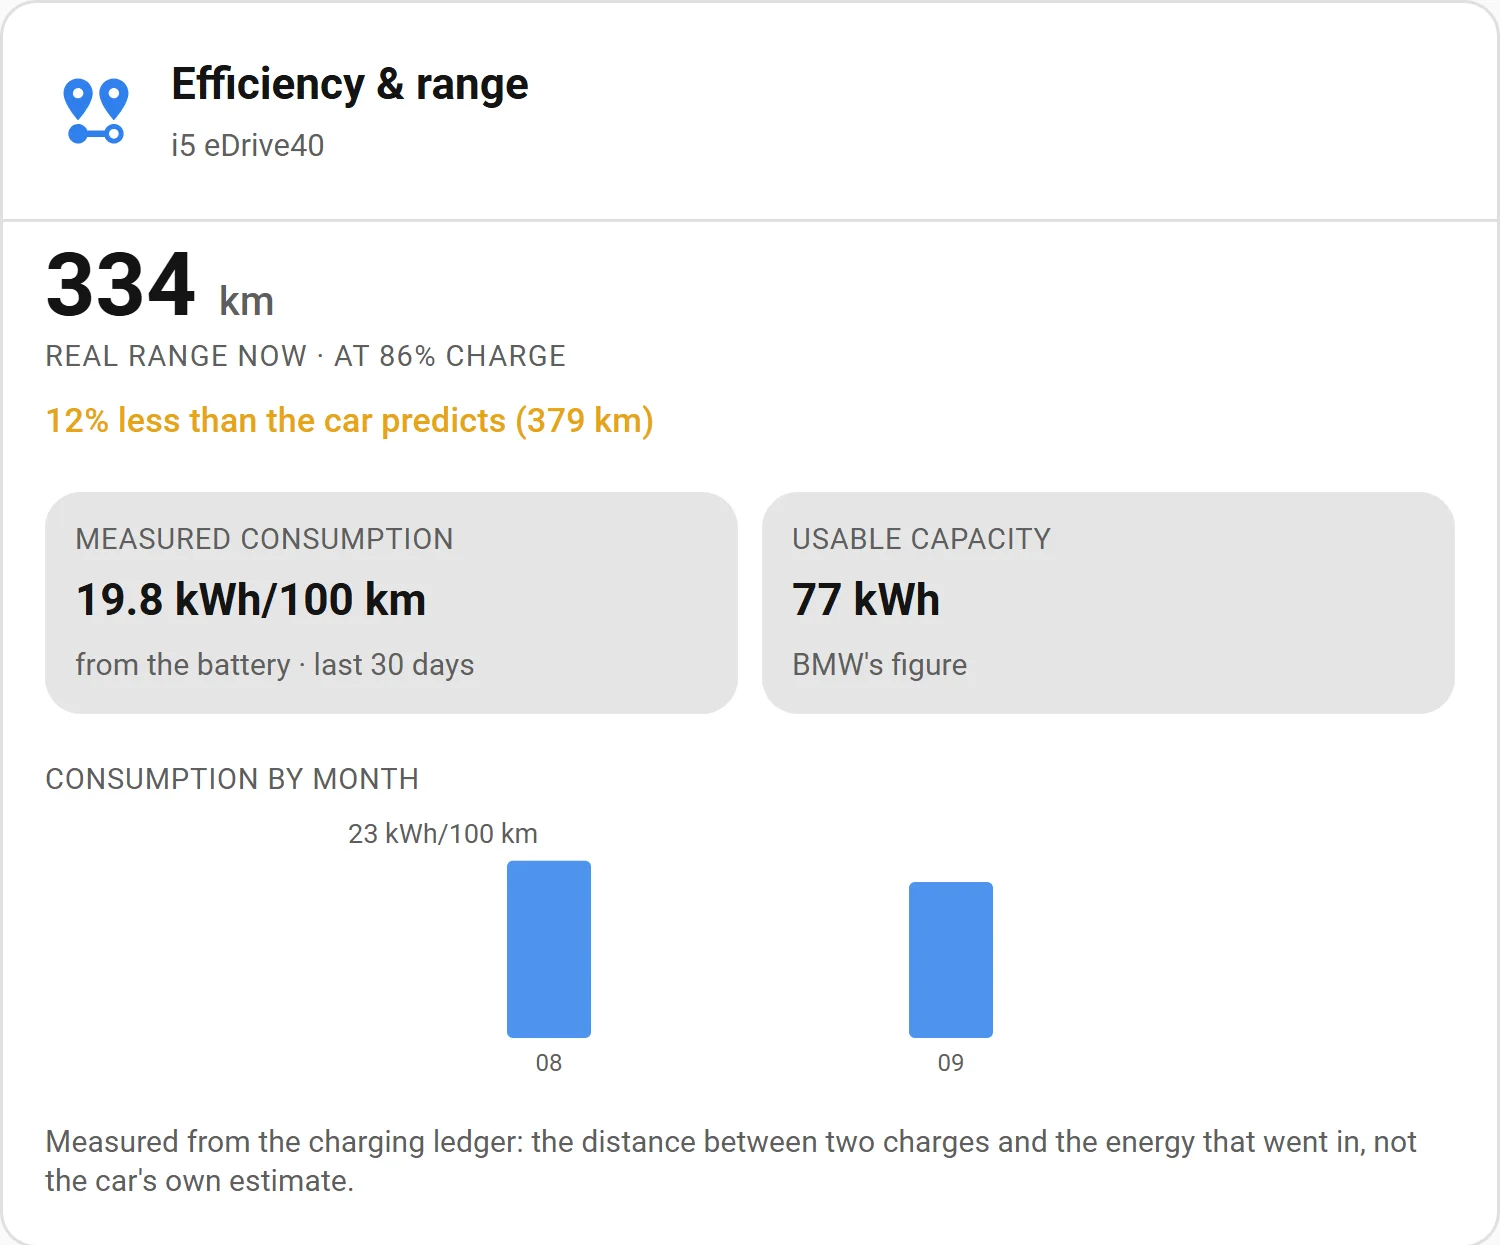
It shows the real range from here (and on a full battery), how that compares with the car’s own remaining-range prediction, the measured consumption with the side of the charger and the window it came from, the measured charging loss where a grid figure exists, the usable capacity it divided into, your cost per 100 km with the month’s solar share, and a bar chart of consumption by calendar month — the seasonal story, since winter consumption is routinely a third above summer. On a plug-in hybrid it explains instead why there is no consumption or range to show (why).
Everything is measured from the charging ledger — two charges bracket a distance and the energy that went into it — so it spends no API quota and never borrows the car’s own estimate (how it’s measured).
Until there is enough charging history to bracket ~50 km of driving, the card says so rather than showing a number.
Trips / driving journal (view: trips)#
Lists your recorded drives, newest first, each showing from → to, distance, duration and a business/private/commute badge; tap one for consumption, recuperation and the SoC used, to reclassify it, and — for drives recorded with Record route on — a small map of the route (drawn as a clean line with a start and end marker; nothing leaves your browser to draw it). Above the list a month in review sums the distance (with a vs-last-month delta), the business/private/commute split, average consumption, energy recuperated, a driving-style score and your top destinations — and, once a tariff is set, an estimated driving cost.
One month at a time. A ‹ August 2026 › control under the header scopes the
list, the month-in-review and the CSV / Report buttons to a single
calendar month. Page back to reach older records — history is kept for two years
by default (retention), which is far more than any
one screen should show at once. Forward stops at the current month.
Average consumption is measured from the charging ledger and the odometer, not from the trips, and is labeled at the battery or at the plug according to where the energy was actually measured — plug-side only once every charge carries a measured grid figure, in which case the battery-side figure appears beneath it with the charging loss between them. See how consumption is measured.
A drive still under way leads the list, marked with a live badge and an accent edge: where you set off from, the distance and time so far, and — with Record route on — the route as it grows. It carries no classification buttons, because there is no stored trip to classify until it ends (details).
type: custom:bavariandata-card
view: trips
It reads the get_trips and get_driving_summary services, so it spends no
API quota. Trips are reconstructed from the stream — no configuration needed.
Endpoints are stored as place names, never coordinates. Set a work zone
under Configure → Trips so home↔work drives are recognized as commutes
(see Trips).
This is a trip journal and expense helper — not a tax-office-compliant logbook (kein Finanzamt-konformes Fahrtenbuch): it has no legal tamper-resistance.
Trip map (view: map)#
A destinations map: it plots where your trips end, and those markers cluster into counted bubbles when you zoom out and split apart as you zoom in — a quick read on where you go most. Only the end of each trip is shown (a trip’s start is the previous trip’s end, so plotting both would double-count), giving an honest “times arrived here” count. Click a cluster to zoom into it. A chip row switches the time window — This month (default), 3 months or All.
To see the route of a particular drive, open the Trips view and expand that trip — its route is drawn on a small map there.
type: custom:bavariandata-card
view: map
The map only has something to show once you turn on Record route under Configure → Trips — that opt-in setting is what stores each drive’s GPS coordinates (it is the only place the integration keeps raw coordinates on disk, and it is off by default). With it off, or before your first drive with it on, the view explains that no places have been recorded yet. Drives recorded before you enabled it have no coordinates to place.
It reads endpoints through the get_trips service, so it spends no API quota,
and it reuses Home Assistant’s own map component and marker clustering (map tiles
load from OpenStreetMap, as they do for the built-in Map card).
Privacy: unlike the rest of the history layer — which stores place names, never coordinates — this view uses the recorded coordinates of your trip endpoints, home included. Only enable route recording if you’re comfortable with that, and remember the map is visible to anyone who can see the dashboard.
Tires (cluster: tire)#
Draws a top-down car with each tire colored by condition, a summary of the whole set at the top, and each wheel’s own readings and fitment beside it.
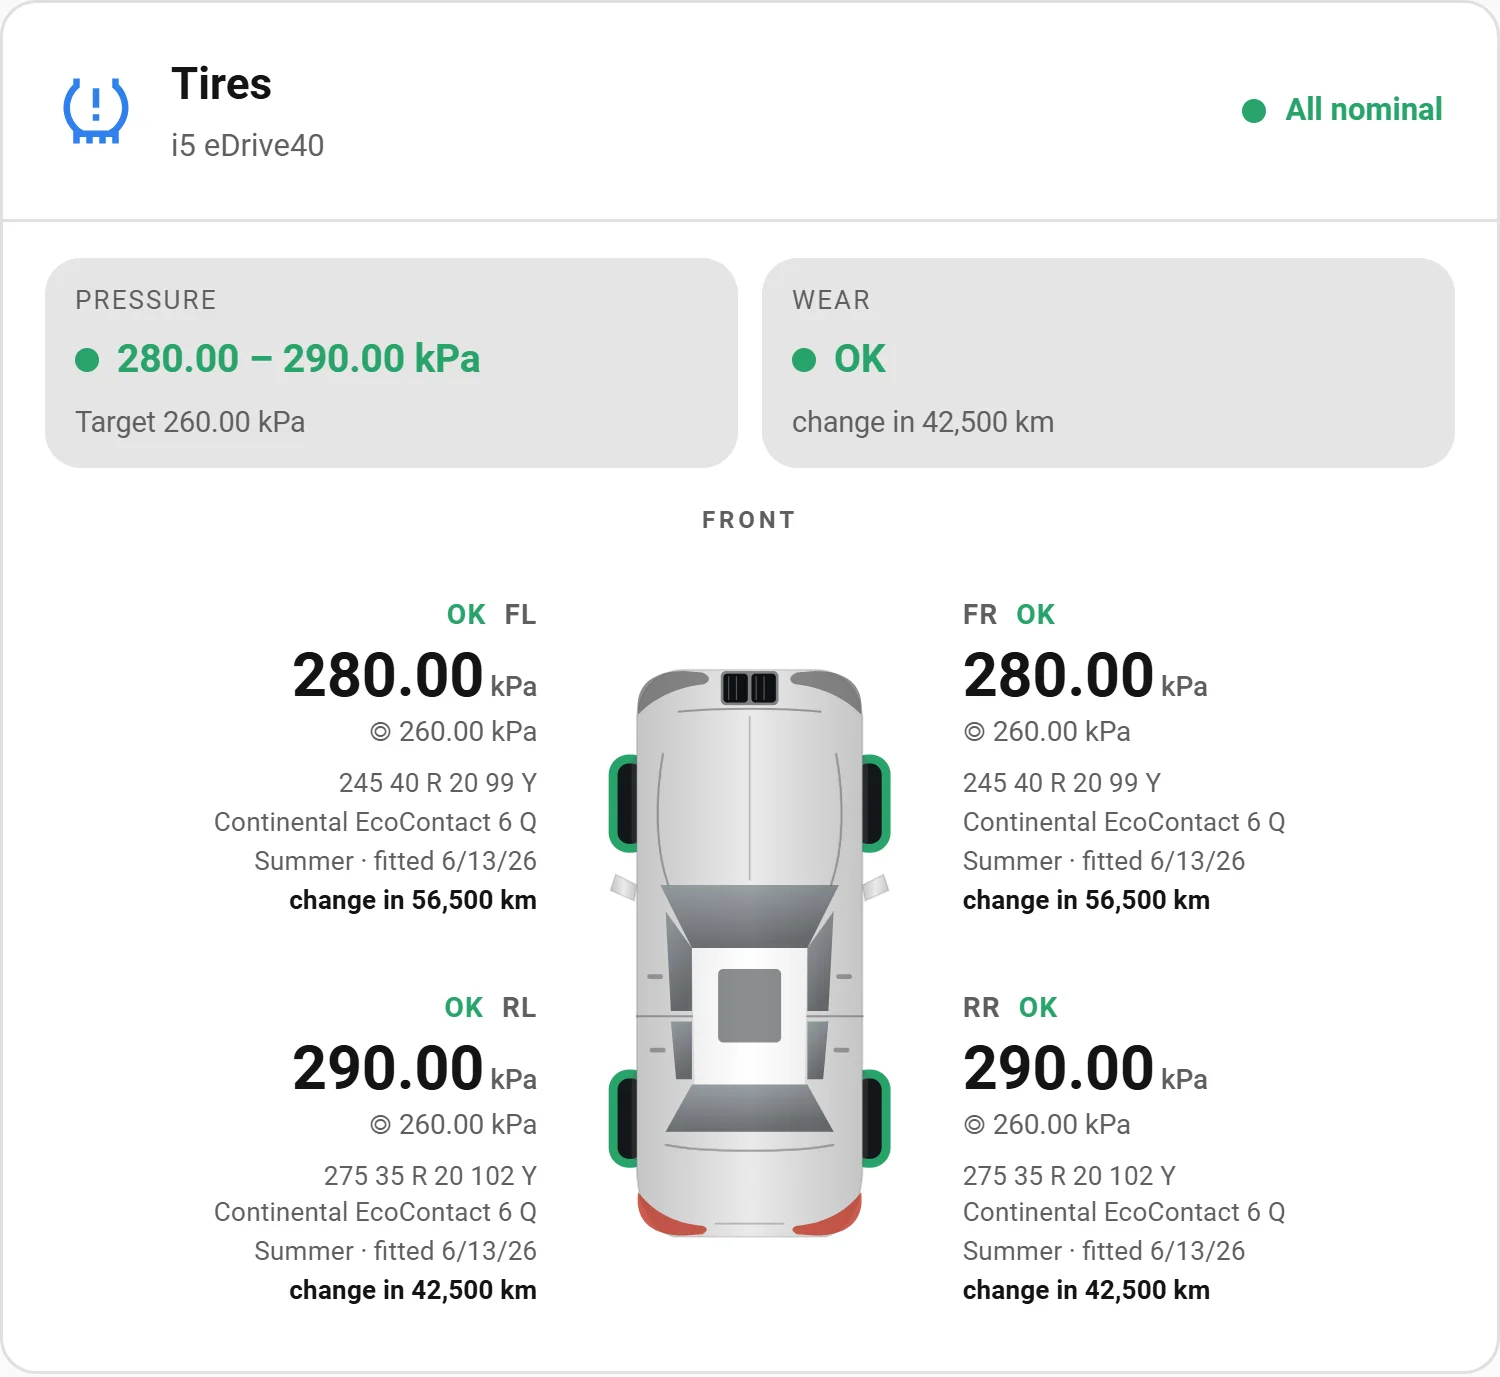
type: custom:bavariandata-card
cluster: tire
The summary at the top holds the two things that can be wrong with a tire, side by side: Pressure (the measured spread across the set, with the shared target underneath) and Wear (BMW’s verdict, with the mileage until the soonest wheel is due). The badge in the header is the combined verdict for the whole car.
Pressure comes from the stream, judged against each wheel’s own target. The band is deliberately lopsided — low from 8% under target, high only past 15% over — because the target is a cold pressure and a tire you have just driven on reads 8–10% high without anything being wrong.
Wear comes from BMW’s smart-maintenance tire diagnosis, refreshed by the daily refresh. When it is available, each wheel also shows its own size, tread pattern, season, fitting date and the mileage until a change is due. These are per wheel on purpose: staggered setups (different sizes front and rear) are normal, and a single line under the diagram would have to pick one to show.
Wear outranks pressure in the color and the header: a tire BMW flags as worn reads “Check tires” even at perfect pressure, because pressure is trivially fixable and tread is not. If your car has no tire service record on file BMW returns nothing here, the wear parts are simply absent, and the card shows pressure alone.
On a narrow dashboard column the car diagram drops out and the four wheels fall back to a 2×2 grid, front row over rear.
Security & closures (cluster: closures)#
Shows doors, windows, hood, trunk, sunroof, the central lock and the anti-theft alarm on the same car diagram. Open doors highlight red, open windows/sunroof amber, and a central padlock reflects the lock state — read from the streamed Doors overall state, so it tracks the real lock rather than the stale REST-only Doors lock (why); a badge summarises the worst-case status and every part taps through to the underlying entity. Parts the vehicle doesn’t report are simply omitted.
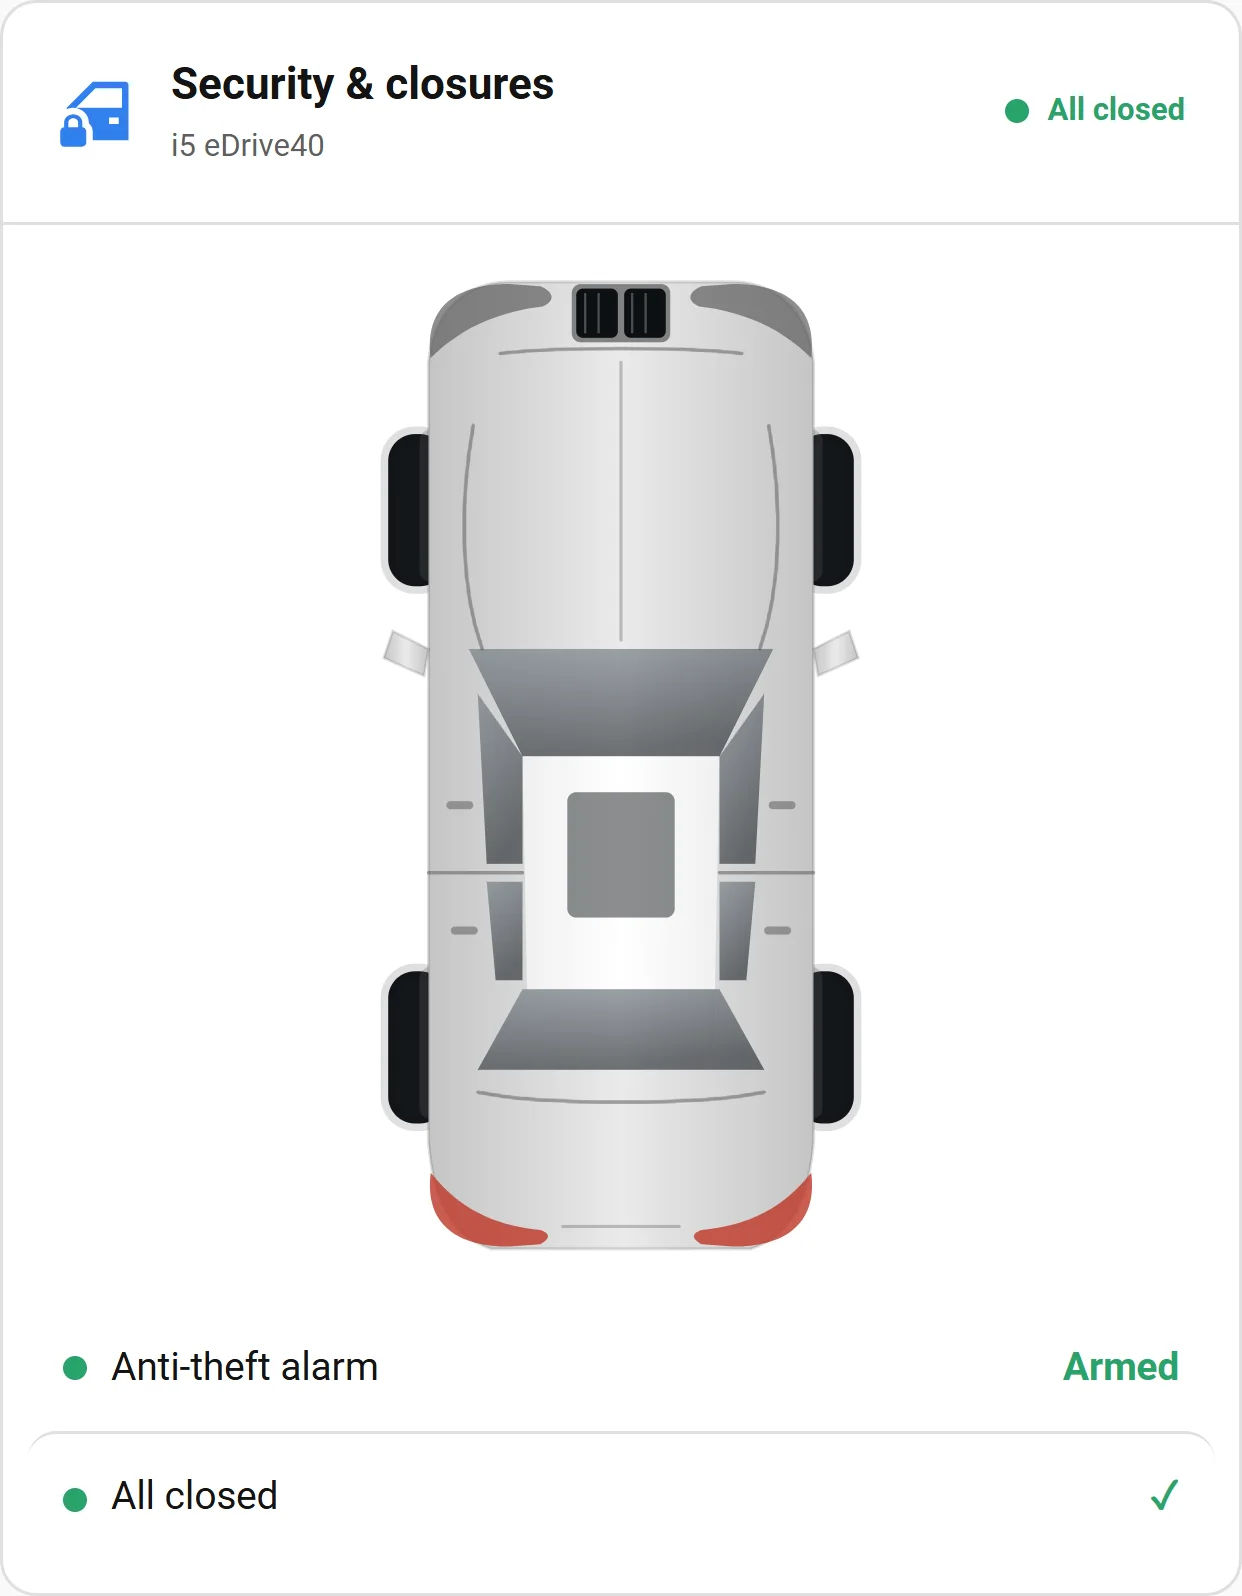
type: custom:bavariandata-card
cluster: closures
Single-cluster list#
Set cluster: to list every value in one catalogue cluster. Use one card per
cluster:
type: custom:bavariandata-card
cluster: electric   # electric · status · tire · usage · events · basic · contract · metadata · other
The card groups entities via their cluster/category attributes, not their
names — so it works regardless of the user’s Home Assistant language.
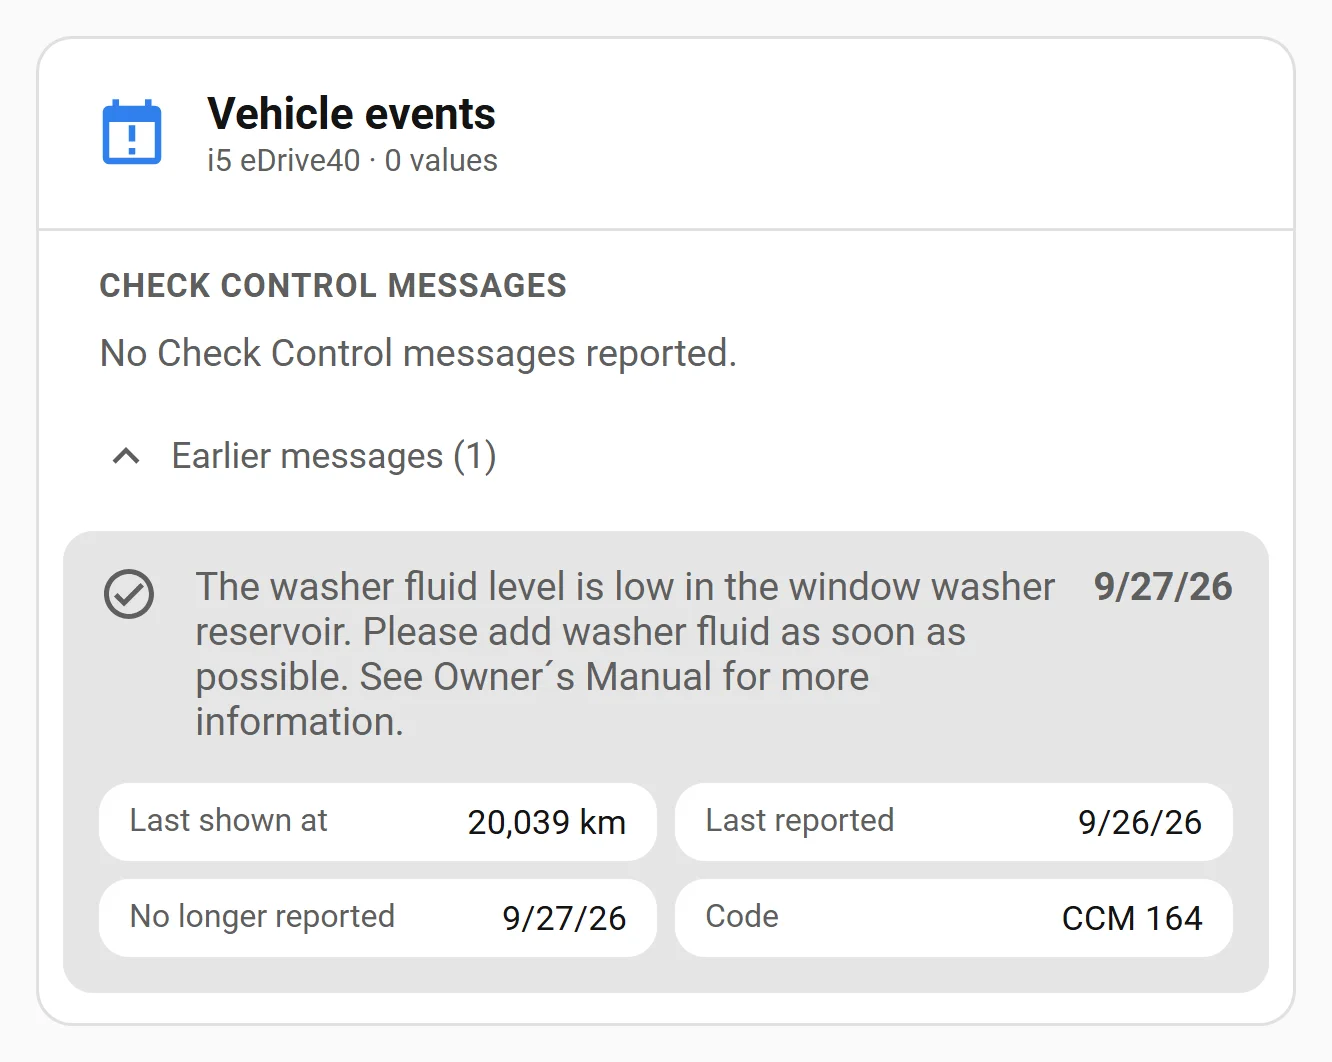
cluster: events leads with the car’s Check Control messages — the warnings
the car shows on its own display, such as low washer fluid — and says so when
there are none. Tap a message to expand it: the mileage at which the car last
showed it, how long ago the car sent it, and BMW’s message code. The text is shown as BMW sends it, which is English whatever your
language. A message the car no longer reports — the washer fluid has been topped
up — leaves the list and moves under Earlier messages, folded away until you tap
it, with the day it was last reported and the day it stopped. The car sends its
messages when a drive starts and the integration reads them once a day, so a
cleared warning can take up to a day and a drive to move. The messages come from the Check Control messages sensor, which BMW
files under usage-based data; BMW’s own Vehicle events cluster holds only two
teleservice timestamps, listed below the messages when the car sends them.
Full YAML reference#
| Key | Purpose |
|---|---|
type | Always custom:bavariandata-card. |
view | charging, trips, map, health or efficiency. Omit for the Overview. |
cluster | electric, status, tire, usage, events, basic, contract, metadata, other, closures. Renders a single-cluster list (or the special tire/closures diagrams). |
device | Device id, to pin a specific vehicle. The visual editor lists your cars only, never the CarData Debug Device; a card set to it shows the first car instead. |
vin | VIN, as an alternative to device. |
title | Override the card title entity. |
image | Override the vehicle-image entity. |
soc | Override the state-of-charge entity. |
range | Override the range entity. |
charging | Override the charging-status entity. |
target_soc | Override the target-SoC entity. |
time_to_full | Override the time-to-full entity. |
odometer | Override the odometer entity. |
plug | Override the plug-status entity. |
drivetrain | bev, phev or ice — the Overview layout. Omit to detect it from what the car streams. |
fuel | Override the fuel-tank entity (a percentage or a volume). |
With the integration installed, entity overrides are rarely needed — the card auto-discovers them from the vehicle’s device. Use them only if you’ve renamed entities or want to point the card at a helper.
Does this look right on your car? The card is only ever seen on an i5 here. A screenshot of it on a different model is the single most useful thing you can send — especially if a view comes up empty, a value looks wrong, or a cluster you expected is missing. Post it in Discussions →